

本页描述了CIP scripting包的分段功能
One can found additional information on the function parameters (type, optional/required, positional/named) on the 参数文档页面。
要访问另一类 CIP 功能:格式, 筛选, 数学, 部分, 评估, 实验性的.
阈值
描述
this function creates a binary image from an input graylevel image
签名
outputImage = cip.threshold( inputImage* , threshold*)
outputImage, threshold = cip.threshold( inputImage* , method*, output)
输入
inputImage* :要处理的图像
threshold* :用于对图像进行阈值处理的标量值
method* : {‘huang’, ‘ij1’, ‘intermodes’, ‘isoData’, ‘li’, ‘maxEntropy’, ‘maxLikelihood’, ‘mean’, ‘minError’, ‘minimum’, ‘moments’, ‘otsu’, ‘percentile’, ‘renyiEntropy’,’rosin’, ‘shanbhag’, 中的字符串’三角形’,’日元’}。
output :{‘image’, ‘value’, ‘both’}中的字符串定义输出类型。
输出
outputImage:处理后的图像。 阈值:为作为输入提供的图像和方法计算的阈值。
例子
img2 = cip.threshold( img1 , 500 )
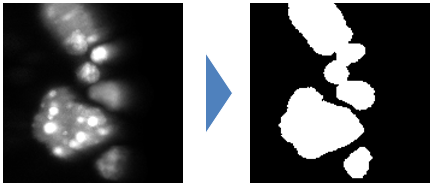
执行
the threshold method wraps ops threshold methods
# 标签
描述
This function threshold an image and label its connected component (i.e. it sets the pixels of each region to a distinct integer value).
签名
outputImage = cip.label( inputImage* , threshold)
输入
inputImage* :要处理的图像
阈值:对图像进行阈值处理的标量值。如果输入图像是二值图像,则不需要阈值
输出
outputImage:标签图(背景为 0 的图像,其中每个识别的区域都有一个不同的整数值)。
例子
img2 = cip.label( img1 )

执行
The labeling is performed our custom implementation. It uses a union find approach relying pixel runs to speed up to labeling process. The source code is available on github. The principle of the algorithm was described in [1].
[1] 卡巴莱、洛朗、莱昂内尔·拉卡萨涅和路易莎·乌德尼。 “世界上最快的连接组件标记算法的回顾:速度和能量估计。”信号和图像处理的设计和架构 (DASIP),2014 年会议。 IEEE,2014。
顶部
描述
This function detects the intensity maxima of an imaget and return a labeled image of these maximage.
签名
outputImage = cip.maxima( inputImage* , threshold, heightMin, areaMin, distanceMin, scaleMin, scaleMax, method, pixelSize)
输入
inputImage* :要处理的图像
阈值:最大值的最小强度
heightMin :最大峰值的最小动态。定义此值会触发扩展的最大值检测,除非定义了比例参数
areaMin:最大峰值的最小面积(以像素为单位)。如果定义了 heightMin,则忽略该值。
areaMin :最大值之间的最小像素距离。如果定义了 heightMin 或 areaMin,则忽略该值。
scaleMin :如果定义了该值,则会运行多尺度最大值检测,并且该值表示最大值的最小比例
scaleMax :如果定义了该值,则会运行多尺度最大值检测,并且该值表示最大值的最大比例
method :{‘classic’, ‘height’, ‘area’, ‘distance’, ‘multiscale’} 中的字符串,定义用于最大值检测的方法
pixelSize :定义用于多尺度检测的像素大小的标量或标量列表。默认情况下该值为 1
输出
outputImage :检测到的最大值的标签图像
实验功能
For the multiscale maxima method it is possible to use a parameter defining the type of output returned by the function
output :{‘image’, ‘measure’, ‘both’} 中的字符串,默认值为 ‘image’。如果参数值为“image”,则函数返回 labelMap 图像。如果值为“测量”,则函数 a measure table 指示对象位置和比例。这个想法是为了让检测的可视化更加灵活。最终返回具有适当半径的球体区域可能会更方便,因为它们可以通过 cip.show 立即可视化
例子
img2 = cip.maxima( img1 , 'hmin', 200 )
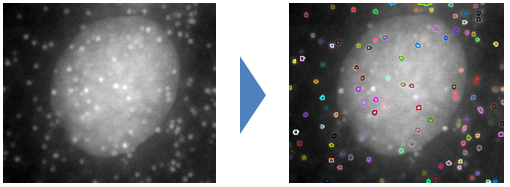 上图显示了原始数据之上检测到的区域的轮廓
执行
上图显示了原始数据之上检测到的区域的轮廓
执行
Each maxima detection method rely on a custom implementation
Classic 方法是最大值检测的并集查找实现
Height 和 Area 方法源自属性过滤方法[1],仅使用不同的属性峰高度或面积作为标准来合并峰并停止其延伸。
Distance 是更简单但有效的方法,它在图像上传递过滤器窗口并检查窗口中的所有像素值是否低于或等于中心像素。如果图像包含柏拉图,此方法可能会出错。
MultiScale 方法在该尺度空间中构建高斯金字塔和检测的差异。其实现原理在[2]中有很好的描述。
[1] Meijster, A. 和 Wilkinson, M. H. (2002)。置换集开心血管和闭心血管的算法比较。IEEE模式分析和机器智能汇刊,24(4), 484-494。
[2] Lowe,D.G. (2004)。来自尺寸固定关键点的独特图像特征。国际计算机视觉杂志,60(2), 91-110。
分水岭
描述
Watershed algorithm partitions an image in regions and outputs a label image of these regions. Initialized with image maxima or or user defined regions the algorithm grow these seed regions following the shape of, i.e. flooding, intensity peaks.
签名,输入1
outputImage = cip.watershed( inputImage* , threshold, heightMin, peakFlooding, method)
inputImage* :要处理的图像
阈值:区域生长停止的强度值
heightMin :用于初始化分水岭的峰值的最小动态。默认为图像动态的5%
peakFlooding:最高洪水的百分比。 0 表示该区域将缩小到顶部,而 100 表示整个区域。
method : {‘gray’,’binary’} 中的字符串,定义分水岭是在灰度图像或距离图上计算
签名,输入2
outputImage = cip.watershed( inputImage* , seed, threshold)
inputImage* :要处理的图像
seed :将初始化分水岭过程的区域的标签图像
阈值:区域生长停止的强度值
输出
outputImage :检测到的最大值的标签图像
例子
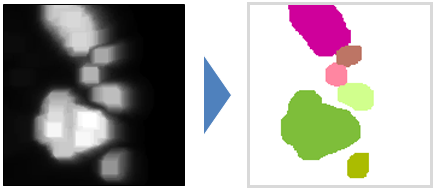
img2 = cip.watershed( img1 , 'threshold', 500, 'hmin', 300 )
在该示例中,分水岭的起点是输入图像的扩展最大值。
执行
Both seeded watershed and H-watershed are implemented based on the image foresting transform approach [1]. The H-watershed adds the construction of a hierarchical tree of segment that can be used in further applications. Both implementations can be found here and there
[1] Lotufo, R. D. A.、Falcão, A. X. 和 Zampirolli, F. A. (2002)。灰度标记的 IFT 分水岭。计算机图形和图像处理,2002 年。论文集。第十五届巴西研讨会(第 146-152 页)。 IEEE。