


自迁移出 MediaWiki 以来,本页内容尚未经过审查。如果您愿意帮忙,请查看帮助指南!
Jython中的示例。
打开“插件 - 脚本显示 - Jython Interpreter”(请参见Scripting Help)并确保打开了一个 TrakEM2 项目,并打开了。然后输入或粘贴下面的示例。
或者使用“文件 - 新建 - 脚本”打开一个新的Script Editor窗口,然后粘贴示例,选择“语言 - Python”,然后按“运行”按钮。
TrakEM2 脚本简介
一些基础知识:
- 图像被拖入并可视化的租赁是Display对象的一部分。休眠有方法访问其Selection,以及显示器正在查看的Layer和LayerSet。
- 图层包含 Patch(每个块包含一个图像)和DLabel(浮动文本)等 2D 对象。
- LayerSet 包含 3D 对象,如 AreaList、Pipe、Polyline、Ball、Dissector、Treeline 和 Stack(后者包装了包含 ij.ImageStack 的 ij.ImagePlus)。
Layer 和 LayerSet 在某种程度上都是容器。LayerSet 还包含图层列表。显示器仅查看图层集中的数据,一次一个图层。
相关完整列表,请参阅第TrakEM2 class diagram。
另请参阅完整的TrakEM2 API documentation
要运行脚本,请按照第 Scripting Help 中的说明进行操作。
获取选定图像的实例
>>> p = Display.getFront().getActive()
>>> print p
    090504_0314_ex0768.mrc z=0.0 #67398
获取所选图像的ImagePlus
>>> p = Display.getFront().getActive()
>>> imp = p.getImagePlus()
>>> print imp.width, imp.height
    2048 2048
访问显示的图层和选择
“前面”是最后激活的显示窗口。如果只有一个显示窗口,那就是“前”。要访问前显示,我们在命名空间 Display中调用静态函数getFront():
>>> front = Display.getFront()
>>> layer = front.getLayer()
>>> layer_set = front.getLayerSet()
>>> sel = front.getSelection()
>>> print sel.getSelected().size()
    10
    >>> print sel.isEmpty()
    0
在 Jython 中,1 为 True,0 为 False
如上所示,Display中最有趣的数据成员主要是Layer和Selection。
锁定所有选定的对象
for d in Display.getFront().getSelected():
  d.setLocked(True)
获取精选图像的集合
Display的Selection对象可以返回多个包含任何选定对象的集合,例如Patch类型(包裹图像的对象)。您需要做的就是使用要过滤的类的名称来调用§§3§§§)</i:
for d in Display.getSelected(Patch):
  print d.title
上面是一个静态调用,用于检索前面所有其他窗口正好被激活的显示窗口的列表。如果您有显示实例,请通过显示的选择执行相同的操作:
front = Display.getFront()
selection = front.getSelection()
for d in selection.get(Patch):
  print d.title
找到定位浮动文本标签下的图像的文件路径
这个想法是在图像上添加浮动文本标签(使用文本工具),然后每个搜索标签的X、Y坐标下的所有图像。然后我们打印
regularExpression = ".*fold.*"

for layer in Display.getFront().getLayerSet().getLayers():
  for label in layer.getDisplayables(DLabel):
    if label.getTitle().matches(regularExpression):
      tx = label.getAffineTransform().getTranslationX()
      ty = label.getAffineTransform().getTranslationY()
      patches = layer.find(Patch, tx, ty)
      for patch in patches:
        print patch.getImageFilePath()
在 jython 中设置和获取成员对象
在 Jython 中和在 Python 中一样,成员对象自动具有 get 和 set 函数。
例如,虽然 Displayable 具有 字符串标题成员,但这是用于获取和设置 Displayable 标题(如 Patch)的有效 Python 代码:
>>> p = Display.getFront().getActive()
>>> print p.title
    090504_0314_ex0768.mrc
上面,默认情况下,Patch 将包含 ImagePlus 的文件名作为标题。让我们将标题更改为其他内容:
>>> p = Display.getFront().getActive()
>>> p.title = "A new name for this Patch"
>>> print p.title
A new name for this Patch
Displayable 的属性:标题、颜色、可视性、锁定、alpha、仿射变换、尺寸和边界
让我们设置几个值:
>>> p = Display.getFront().getActive()
>>> p.title = "Test image"
>>> p.alpha = 0.4
>>> p.visible = True
>>> p.locked = False
>>> from java.awt import Color
>>> p.color = Color.blue
告知所有显示器更新功耗,以便我们看到更改:
>>> Display.repaint()
让我们读取几个值:
>>> p.getAffineTransform()
AffineTransform[[1.0, 0.0, 474.0], [0.0, 1.0, 567.0]]
>>> print p.getBoundingBox()
java.awt.Rectangle[x=474,y=567,width=2048,height=2048]
无法设置射变换,因为它是最终成员。但该值本身可以通过 setAffineTransform 进行编辑:
>>> from java.awt.geom import AffineTransform
>>> aff = AffineTransform()
>>> aff.scale(2.0, 2.0)
>>> p.setAffineTransform(aff)
>>> p.updateBucket()
请注意:java的AffineTranform执行矩阵而不是预矩阵(矩阵乘法中的顺序很重要)。
在大多数情况下,您想要的可以通过preTransform</i来完成,例如翻译图像:
>>> from java.awt.geom import AffineTransform
>>> aff = AffineTransform()
>>> aff.translate(300, -400)
>>> p.preTransform(aff, True)
更方便的方法 缩放、翻译、旋转,特别是preTransform,用于操作Displayable的仿射转换(参见AffineTransform)及其可显示的链接(任何变换都会传播到链接的变换)。
如果直接更改 Displayable 的仿射变换(通过调用 getAffineTransform()然后操作),请记住,您很可能会修改内部缓存的映射以快速定位 Displayable 对象。要解决此问题,请务必对接下来的 Displayable 对象调用 updateBucket()。
导入图像、剪辑它们、混合它们并另存为.xml
接下来是一个小脚本,它从单个文件夹导入图像,通过匹配文件名的正则表达式模式来排序哪些图像进入哪个层(部分)。
然后将图像逐层剪辑并混合在一起(重叠图像的亲密淡出)。
请注意,要制作适合您的脚本,您必须编辑两行:
1.可以找到图片的来源folder。
2.要匹配的pattern,它指示哪个图像进入哪个层。
请确保根据需要创建所需的多层。如果您不知道,请对 layerset标记使用 getLayer方法,该方法能够在要求为尚不存在图层的 Z 获取图层时创建新图层。
您可能需要查看的文档:Project.newFSProject、[https://fiji.sc/javadoc/ini/trakem2/display/Patch.html#createPatch(ini.trakem2.Project,%20java.lang.String) Patch.createPatch]、[<https://fiji.sc/javadoc/ini/trakem2/display/Layer.html#add(ini.trakem2.display.Displayable) Layer.add]、Align、AlignTask、
# Albert Cardona 2011-06-05
# Script for Colenso Speer

import os, re

#folder = "/path/to/folder/with/all/images/"
folder = "/home/albert/Desktop/t2/example-data/images/2043_5_6_7"

# 1. Create a TrakEM2 project
project = Project.newFSProject("blank", None, folder)
# OR: get the first open project
# project = Project.getProjects().get(0)

layerset = project.getRootLayerSet()

#  2. Create 10 layers (or as many as you need)
for i in range(10):
  layerset.getLayer(i, 1, True)

# ... and update the LayerTree:
project.getLayerTree().updateList(layerset)
# ... and the display slider
Display.updateLayerScroller(layerset)

# 3. To each layer, add images that have "_zN_" in the name
#     where N is the index of the layer
#     and also end with ".tif"
filenames = os.listdir(folder)
for i,layer in enumerate(layerset.getLayers()):
  # EDIT the following pattern to match the filename of the images
  # that must be inserted into section at index i:
  pattern = re.compile(".*_z" + str(i) + "_.*\.tif")
  for filename in filter(pattern.match, filenames):
    filepath = os.path.join(folder, filename)
    patch = Patch.createPatch(project, filepath)
    layer.add(patch)
  # Update internal quadtree of the layer
  layer.recreateBuckets()

# 4. Montage each layer independently
from mpicbg.trakem2.align import Align, AlignTask
param = Align.ParamOptimize()  # which extends Align.Param
param.sift.maxOctaveSize = 512
#  ... above, adjust other parameters as necessary
# See:
#    features: https://fiji.sc/javadoc/mpicbg/trakem2/align/Align.Param.html
#    transformation models: https://fiji.sc/javadoc/mpicbg/trakem2/align/Align.ParamOptimize.html
#    sift: https://fiji.sc/javadoc/mpicbg/imagefeatures/FloatArray2DSIFT.Param.html
AlignTask.montageLayers(param, layerset.getLayers(), False, False, False, False)

# 5. Resize width and height of the world to fit the montages
layerset.setMinimumDimensions()

# 6. Blend images of each layer
Blending.blendLayerWise(layerset.getLayers(), True, None)

# 7. Save the project
project.saveAs(os.path.join(folder, "montages.xml"), False)

print "Done!"
操作可显示对象
重置图层中所有图像的仿射变换
假设你打开项目并发现某个图层的图像具有非刚性仿射变换,并且您想要删除非刚性部分。一个合理的方法将它们的仿射变换重置为恒等,然后将它们转换到原来的位置(基于它们的边界框):
layer = Display.getFront().getLayer()

# Get all selected images
# patches = Display.getFront().getSelection().getSelected(Patch)

# Get all images in the current layer
patches = layer.getDisplayables(Patch)

for patch in patches:
  bounds = patch.getBoundingBox()
  patch.getAffineTransform().setToIdentity()
  patch.translate(bounds.x, bounds.y, False)

Display.repaint()
将以上内容保存到插件目录或子目录下名为“reset_affine_transforms.py”的文件中,可以直接从菜单运行它,或将其复制粘贴到 Jython 解释器中。
另请参阅:像 Patch 一样操作 Displayable object 仿射变换的不同方法。
警告:如果您修改 Patch 的 AffineTransform 并且不调用任何 Displayable 方法来执行此操作(就像我们上面所做的那样:脚本调用“Displayable.translate”),那么您必须自己更新存储桶:
patch.updateBucket()
桶是 Patch 所在的 2D 世界区域。将世界想象成一个棋盘,其中包含在 Patch 对象中的给定图像属于它相交的每个托架。 未更新存储桶将导致重新重新不对——无法找到补丁。
通过扫描切片添加区域中的像素值到区域列表
下面的脚本与命令“导入 - 将标签导入为区域列表”相同。
from ini.trakem2 import Project
from ini.trakem2.utils import AreaUtils
from ini.trakem2.display import AreaList
from java.awt import Color

# Obtain an image stack
#imp = IJ.getImage()
imp = WindowManager.getImage("0_5_filtered.tif")

# Obtain the opened TrakEM2 project
p = Project.getProjects()[0]

# Obtain the LayerSet
layerset = p.getRootLayerSet()

# Create a new AreaList, named "synapses"
ali = AreaList(p, "synapses", 0, 0)

# Add the AreaList to the datastructures:
layerset.add(ali)
p.getProjectTree().insertSegmentations([ali])

# Obtain the image stack
stack = imp.getImageStack()

# Iterate every slice of the stack
for i in range(1, imp.getNSlices() +1):
  ip = stack.getProcessor(i) # 1-based
  # Extract all areas (except background) into a map of value vs. java.awt.geom.Area
  m = AreaUtils.extractAreas(ip)
  # Report progress
  print i, ":", len(m)
  # Get the Layer instance at the corresponding index
  layer = layerset.getLayers().get(i-1) # 0-based
  # Add the first Area instance to the AreaList at the proper Layer
  ali.addArea(layer.getId(), m.values().iterator().next())

# Change the color of the AreaList
ali.setColor(Color.magenta)

# Ensure bounds are as constrained as possible
ali.calculateBoundingBox(None)

Display.repaint()
从区域列表中提取区域将它们作为 ROI 放入 ImageJ 的 ROI 管理器中
# Albert Cardona 2012-06-19
# Obtain an arealist and add all its areas as ROIs in the ROI Manager

from ini.trakem2.display import Display, AreaList
from ij.gui import ShapeRoi
from ij.plugin.frame import RoiManager

def getRoiManager():
  ** Obtain a valid instance of the ROI Manager.
  Notice that it could still be null if its window is closed.**
  if RoiManager.getInstance() is None:
    RoiManager()
  return RoiManager.getInstance()

def putAreas(arealist):
  ** Take all areas of an AreaList and put them in the ROI Manager.**
  for layer in arealist.getLayerRange():
    area = arealist.getAreaAt(layer)
    if area is not None and not area.isEmpty():
      roi = ShapeRoi(area)
      getRoiManager().addRoi(roi)

def run():
  front = Display.getFront()
  layers = front.getLayerSet().getLayers()
  arealists = front.getSelection().getSelected(AreaList)
  if arealists.isEmpty():
    IJ.log("No arealists selected!")
    return
  # Extract areas as ROIs for the first one:
  putAreas(arealists[0])

run()
请注意,python(和 jython)允许您使用对象实例方法作为一等函数以及构造函数。这使我们能够以函数式方式重写“putAreas”函数,取代了使用任何临时变量,也取代了任何 if/else 逻辑:
def putAreas(arealist):
  ** Take all areas of an AreaList and put them in the ROI Manager.**
  def put(arealist):
  map(getRoiManager().addRoi,
      map(ShapeRoi,
          filter(lambda area: not area.isEmpty(),
                 filter(None,
                        map(arealist.getAreaAt, arealist.getLayerRange())))))
#图像添加
将单个图像添加到打开显示中显示的图层中
# Obtain a pointer to the frontmost open display:
front = Display.getFront()
# Open an image
filepath = "/path/to/image.tif"
imp = IJ.openImage(filepath)
# Create a new Patch, which wraps an image
patch = Patch(front.project, imp.title, 0, 0, imp)
patch.project.loader.addedPatchFrom(filepath, patch)
# Add it to a layer
front.layer.add(patch)
在两个打开的项目之间复制图像
该检查脚本有两个显示器已打开,并且它们有两个不同的项目。然后提供一个对话框来至少选择复制方向,最后将所有图像或所有可见或选定的所属图像从一个项目复制到另一个项目:
# Albert Cardona 20100201
# Script to copy all images, all visible images, or all selected images
# from a source layer to a target layer.
# To run the script, put it under Fiji plugins folder or subfolder and call "Plugins - Scripting - Update Fiji"
# and make sure you have at least two projects open, each with at least one display open.
#
# Written for Natalya at Graham Knott's group, EPFL

from ini.trakem2.display import *
from ij.gui import GenericDialog
from ij import IJ
from array import array


def run():
    # Check precondition: at least some displays open
    displays = Display.getDisplays()
    if displays.isEmpty():
        IJ.showMessage("Could not find any TrakEM2 displays open!")
        return
    # Check precondition: at least two displays from two different projects
    projects = {}
    for display in displays:
        projects[display.project] = display
    if len(projects) < 2:
        IJ.showMessage("You need at least two projects with at least one display open for each!")
        return
    # Show choices
    gd = GenericDialog("Copying images between projects")
    titles = array(String, [display.getFrame().getTitle() for display in displays])
    gd.addChoice("Source layer:", titles, titles[0])
    gd.addChoice("Target layer:", titles, titles[1])
    choices = ["All images", "All visible images", "All selected images"]
    gd.addChoice("Copy:", choices, choices[0])
    gd.showDialog()
    if gd.wasCanceled():
        return
    source = displays[gd.getNextChoiceIndex()]
    target = displays[gd.getNextChoiceIndex()]
    if source == target:
        IJ.showMessage("You must choose different source and target layers!")
        return
    copy_mode = gd.getNextChoiceIndex()
    patches = None
    if 0 == copy_mode:
        patches = source.getLayer().getDisplayables(Patch)
    elif 1 == copy_mode:
        patches = source.getLayer().getDisplayables(Patch, True)
    else:
        patches = source.getSelection().getSelected(Patch)
    if 0 == len(patches):
        IJ.showMessage("No images to copy with option: " + choices[copy_mode])
        return
    # Copy images
    for patch in patches:
        p = patch.clone(target.project, False)
        target.getLayer().add(p)
    target.getLayerSet().enlargeToFit(patches)
    IJ.showStatus("Done copying images between layers.")

run()
要使用上述代码创建脚本名称,然后将其复制粘贴到中包含下划线并启动名为“.py”的文件中。然后将其放入Fiji的plugins文件夹中的子文件夹中。最后,重新Fiji或只需调用“插件 - 脚本 - 刷新 Jython 脚本”。
###项目通过复制所有层来连接多个XML文件
# Albert Cardona 2010-06-30 for JC Rah
# Takes a list of project XML files
# and grabs all layers in order
# and clones each and all its images
# and then adds it to a newly created project named "all_layers.xml"


from ini.trakem2 import Project
from ini.trakem2.display import Patch
from ini.trakem2.utils import Utils
from ij import IJ


source_dir = "/path/to/projects/" # MUST have ending slash
project_paths = ["project1.xml", "project2.xml", "project3.xml"]

# folder to save the target project at
target_folder = source_dir

def merge_layers():
  # Create a new project target_folder as the storage folder:
  target = Project.newFSProject("blank", None, target_folder)
  # Save it there as "all_layers.xml" so we can call "save()" on it later
  target.saveAs(target_folder + "all_layers.xml", True)
  targetlayerset = target.getRootLayerSet()
  z = 0
  # For each project to concatenate, open it, and:
  for path in project_paths:
    IJ.log("Processing project " + path)
    project = Project.openFSProject(source_dir + path, False)
    rectangle = project.getRootLayerSet().get2DBounds()
    # For each layer in the project, create a new layer "targetlayer" to host a copy of its images:
    for layer in project.getRootLayerSet().getLayers():
      targetlayer = targetlayerset.getLayer(z, 1, True)
      z += 1
      # Add to the new layer copies of each image
      for ob in layer.getDisplayables():
        targetlayer.add(ob.clone(target, False)) # clone in the context of the target project
    project.getLoader().setChanged(False) # avoid dialog at closing
    project.destroy()
    targetlayerset.setMinimumDimensions()
  # Regenerate all image mipmaps
  futures = []
  for patch in targetlayerset.getDisplayables(Patch):
    futures.append(patch.updateMipMaps())
  Utils.wait(futures)
  target.save() # to validate mipmaps
  #target.destroy()  # comment out to close it
  IJ.log("Done!")

# Invoke the function!
merge_layers()
测量
测量每个球到自定义列表的表面的最小距离
例如,假设您使用Ball object点击了突触终止了每个囊泡。并且,使用profile list,您已经追踪了突触的感应。
|
style="vertical-align:top" | 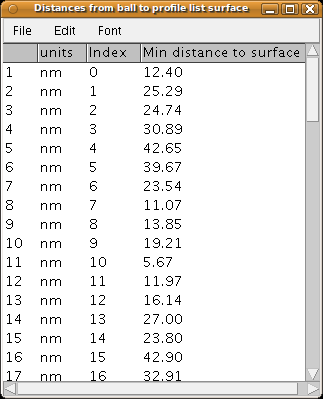 323|Synaptic vesicle measurements of the minimal distance from each vesicle to the synaptic surface
|
style="vertical-align:top" | 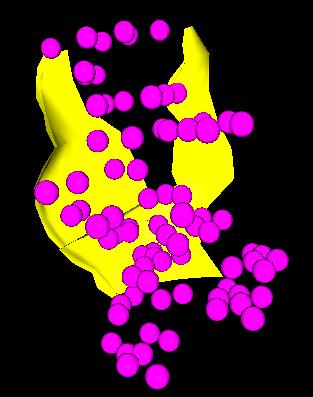 313|3D view of a synaptic surface and its vesicles
|
使用以下脚本,我们从配置文件列表中生成一个表面,然后为每个突触小泡测量其到突触表面的最小距离。 结果列在最终结果表中,可以导出按列排序的数据,以便在电子表格中进一步处理。
# Albert Cardona 20100201
# Select a Ball and a Profile, and list the minimal distances of each ball
# to the nearest vertex of the mesh created by the profile list to which
# the profile belongs.
#
# As asked by Graham Knott and Natalya, from EPFL


from ini.trakem2.display import Display, Ball, Profile
from ini.trakem2.utils import M, Utils
from ij import IJ
from ij.measure import ResultsTable
from ij.gui import GenericDialog
from java.util import HashSet


def run():
	sel = Display.getSelected()
	# Check conditions: one Ball and one Profile only must be selected
	if sel is None or sel.isEmpty():
		IJ.log("Please select a Ball and a Profile!")
		return
	c = [ob.getClass() for ob in sel]
	if Ball in c and Profile in c and 2 == sel.size():
		pass
	else:
		IJ.log("Please select just one Ball and one Profile")
		return
	obs = {}
	for ob in sel:
		obs[ob.getClass()] = ob
	balls = obs[Ball].getWorldBalls()
	profile = obs[Profile]
	profiles = []
	# Gather triangles from profile mesh (into a HashSet to remove the many duplicate vertices)
	verts = HashSet(Profile.generateTriangles(profile.project.findProjectThing(profile).getParent(), 1))
	# Prepare a results table
	rt = ResultsTable()
	rt.setPrecision(2)
	rt.setHeading(0, "Index")
	rt.setHeading(1, "Min distance to surface")
	# Fill data rows
	unit = profile.layer.parent.calibration.unit
	i = 0
	count = len(balls)
	for i in range(count):
		rt.incrementCounter();
		rt.addLabel("units", unit)
		rt.addValue(0, i)
		b = balls[i]
		# For each ball, measure the minimal distance to any of the triangle vertices.
		rt.addValue(1, Math.sqrt(reduce(Math.min, [M.distanceSq(b[0], b[1], b[2], vert.x, vert.y, vert.z) for vert in verts])))
		Utils.showProgress(float(i)/count)
	rt.show("Distances from ball to profile list surface")
	# Reset progress bar
	Utils.showProgress(1)

run()
如果您不介意输入Ball(囊泡)和AreaList(突触表面)的ID,将结果汇总为干系、标准差和中位(每个囊泡到网格的距离),则可获得类似的测量结果,如下所示:
# The IDs of the Ball and AreaList instances
vesiclesID = 1543
synapticSurfaceID = 1541

# Obtain the two TrakEM2 instances
project = Project.getProjects()[0]
vesicles = project.findById(vesiclesID)
synapticSurface = project.findById(synapticSurfaceID)

# A set of unique vertices defining the synaptic surface
vertices = set(synapticSurface.generateTriangles(1, 2))

# For every vesicle, measure its shortest distance to a vertex
distances = [reduce(min, map(lambda v: p.distance(v), vertices))
			 for p in vesicles.asWorldPoints()]

# Compute average, median and standard deviation
mean = sum(distances) / len(distances)
stdDev = Math.sqrt(reduce(lambda s, e: s + pow(e - mean, 2),
						  distances, 0)) / len(distances)
median = sorted(distances)[len(distances)/2]

print mean, stdDev, median
与层(部分)交互
调整和设置 Z 尺寸
每个Layer存储一个Z坐标和一个具有双精度精度的厚度值。Z坐标以像素为单位。
如何计算 Layer 的 Z 坐标:假设布局指定 4x4x50 nm。这意味着 X 轴为 4 nm/px,Y 轴为 4 nm/px,Z 轴为 50 nm/px。假设您通过右键单击分区窗口并选择“显示 - 坐标…”来设置此值,这将打开熟悉的 ImageJ 对话框进行图像图表。
然后你必须计算相对于X轴坐标的厚度。因此:
layer thickness = (Z calibrated thickness) / (X calibrated thickness)
在我们的 4x4x50 nm/px 示例中:
layer thickness = 50 / 4 = 12.5
然后我们必须为每个部分设置这个厚度。这包括在 图层树(位于 TrakEM2 窗口中列出图层的树)上执行的以下步骤:
1.右键单击图层树的“顶层[图层集]”节点。
` Then choose “Reset layer Z and thickness”.`
2.单击第一层节点,然后单击最后一层节点的⇧ Shift +  Left Click。
` All nodes will be selected.`
3.右键选定节点并选择“缩放…”。 4.在对话框中,输入“12.5”——我们上面计算的值。
要以编程方式完成相同的任务,请执行以下操作:
z = 0
thickness = 12.5
# Obtain the LayerSet instance:
layerset = Display.getFront().getLayerSet()
#
for layer in layerset.getLayers():
  layer.setZ(z)
  layer.setThickness(thickness)
  z += thickness

# Update the GUI
layerset.getProject().getLayerTree().updateUILater()
与 Treeline、AreaTree 和 Connector 交互
所有不同类型:“treeline”、“areatree”和“connector”均由继承自抽象类ini.trakem2.display.Tree的同名类表示。
Tree是Displayable,因此表示诸如、alpha、颜色、固定、可见之类的属性,这些属性可以通过其同调的 set 和 get 方法访问(例如setAlpha(0.8f);,getAlpha();等)
根Node可以访问Tree的剩余节点。在遍历上,用户可以在选定的Treeline、AreaTree或Connector上按“r”,将视野遍历根节点所在的位置。从代码中,我们会调用:
# Acquire a reference the selected object in the Display
t = Display.getFront().getActive()
# If t is not a Tree, the following will fail:
root = t.getRoot()
现在有了我们对根 Node 的引用,我们将要求它提供子树节点的整个集合:Tree 中的所有节点:
nodes = root.getSubtreeNodes()
NodeCollection是调用的并且不进行缓存。如果你计划开始调用size(),然后迭代其节点,则最终会迭代整个序列两次。那么让我们从复制它:
nodes = [nd for nd in nodes]
每个Node都有:
- X、Y坐标,相对于包含Node的树的局部坐标系。 2.对图层的引用(通过nd.getLayer()获取)。Layer有一个getZ()方法来获取Z坐标(以像素为单位)。
- 数据字段,可以是半径或java.awt.geom.Area(见下文)。
每个 Node 都包含一个 getData() 公共方法来获取其所拥有的任何内容:
- 树线和连接器:其节点getData()返回半径。默认值相等。
- AreaTree:其节点 getData() 返回一个 java.awt.geom.Area实例,如果尚未分配给它,则返回 null。
获取Tree中所有节点的X,Y,Z坐标
以下是如何迭代世界坐标中所有节点的X、Y、Z位置:
from ini.trakem2.display import Display
from jarray import array

def getNodeCoordinates(tree):
  ** Returns a map of Node instances vs. their X,Y,Z world coordinates. **
  root = tree.getRoot()
  if root is None:
	return {}
  calibration = tree.getLayerSet().getCalibration()
  affine = tree.getAffineTransform()
  coords = {}
  #
  for nd in root.getSubtreeNodes():
	fp = array([nd.getX(), nd.getY()], 'f')
	affine.transform(fp, 0, fp, 0, 1)
	x = fp[0] * calibration.pixelWidth
	y = fp[1] * calibration.pixelHeight
	z = nd.getLayer().getZ() * calibration.pixelWidth   # a TrakEM2 oddity
	# data may be a radius or a java.awt.geom.Area
	coords[nd] = [x, y, z]
  #
  return coords

# Obtain the tree selected in the canvas:
tree = Display.getFront().getActive()

# Print all its node coordinates:
for node, coord in getNodeCoordinates(tree).iteritems():
  x, y, z = coord
  print "Coords for node", node, " : ", x, y, z
点击标签对节点进行排序
from ini.trakem2.display import Display

def sortNodesByTags(tree):
  table = {}
  root = tree.getRoot()
  if root is None:
	return table # empty
  #
  for nd in tree.getRoot().getSubtreeNodes():
	tags = nd.getTags()
	if tags is None:
	  continue
	for tag in tags:
	  tagged = None
	  if table.has_key(tag):
		tagged = table[tag]
	  else:
		tagged = []
		table[tag] = tagged
	  tagged.append(nd)
  #
  return table

# Obtain the currently selected Tree in the canvas:
tree = Display.getFront().getActive()

# Print the number of nodes that have any given tag:
for tag, tagged in sortNodesByTags(tree).iteritems():
  print "Nodes for tag '" + str(tag) + "':", len(tagged)
计算每个节点的介数中心性
中心性是根据任何可能的节点对被遍历该节点的路径链接的次数来最简单树中节点的重要性。
我们使用的方法是Ulrik Brande计算介数中心性的快速算法(参见paper)。
类 Tree 的方法 computeCentrality() 返回 Node 实例的 Map 其中中心性值:
from ini.trakem2.display import Display

# Obtain the currently selected Tree in the canvas:
tree = Display.getFront().getActive()

# Compute betweenness centrality
bc = tree.computeCentrality()   # a java.util.Map

# Print the value for each node
for e in bc.entrySet():
  print e.getKey(), "=>", e.getValue()
然后,我们可以利用中心性通过热图对树进行着色:中心性值校正,黄色越浓;越低,蓝色越浓:
from ini.trakem2.display import Display
from java.awt import Color

def computeColor(centrality, highest):
  red = centrality / float(highest)
  blue = 1 - red
  return Color(red, red, blue)

# Obtain the currently selected Tree in the canvas:
tree = Display.getFront().getActive()

# Compute betweenness centrality
bc = tree.computeCentrality()   # a java.util.Map

# Find out the maximum centrality value, to scale:
maximum = reduce(max, bc.values())

# Colorize each node according to its centrality
for e in bc.entrySet():
  node = e.getKey()
  centrality = e.getValue()
  node.setColor(computeColor(centrality, maximum))

# Update display
Display.repaint()

# Show the tree in the 3D Viewer
Display3D.show(tree.getProject().findProjectThing(tree))
计算每个节点的度
节点的度是指将其与根节点分开的父节点的数量。它是 Tree 中的内置函数(Node 中):
在下面的示例中,我们根据节点的度数对树进行着色:越靠近根,最热:
from ini.trakem2.display import Display
from java.awt import Color

def computeColor(degree, highest):
  blue = degree / float(highest)
  red = 1 - blue
  return Color(red, red, blue)

# Obtain the currently selected Tree in the canvas:
tree = Display.getFront().getActive()

# Compute betweenness centrality
degrees = tree.computeAllDegrees()   # a java.util.Map

# Find out the maximum degree value, to scale:
maximum = reduce(max, degrees.values())

# Colorize each node according to its degree:
for e in degrees.entrySet():
  node = e.getKey()
  degree = e.getValue()
  node.setColor(computeColor(degree, maximum))

# Update display
Display.repaint()

# Show the tree in the 3D Viewer
Display3D.show(tree.getProject().findProjectThing(tree))
查找分支或结束节点
Tree类提供了获取所有分支点、终点或两者的列表的方法:
from ini.trakem2.display import Display

# Obtain the currently selected treeline or areatree or connector:
tree = Display.getFront().getActive()

# A collection of all end nodes (not lazy):
endNodes = tree.getEndNodes()

# A lazy collection of all branch nodes:
branchNodes = tree.getBranchNodes()

# A lazy collection of both all end nodes and all branch nodes:
endOrBranchNodes = tree.getBranchAndEndNodes()
请记住,这些指定集合是非存储的。如果你对它调用 size() ,就会遍历整个节点树,只是为了查找存在多少个此类节点。
如果要排序排序所有节点,请查询每个节点拥有的子节点数量:
- 如果为0,则为结束节点
- 如果为1,则它是一个slab节点
- 如果大于1,则为分支节点 ```python from ini.trakem2.display import Display
Obtain the currently selected treeline or areatree or connector:
tree = Display.getFront().getActive()
endNodes = [] branchNodes = [] rest = []
for nd in tree.getRoot().getSubtreeNodes(): count = nd.getChildrenCount() if 1 == count: rest.append(nd) elif 0 == count: endNodes.append(nd) else: branchNodes.append(nd)
print “Found:” print “end nodes:”, len(endNodes) print “branch nodes:”, len(branchNodes) print “slab nodes:”, len(rest)
请记住,<i>根</i>节点将列在上面的节点中,因此它不被算作结束节点(去掉它没有任何子节点,例如,当树仅由根节点组成时)。

## 通过连接器查找树在哪些节点连接到其他树

这里的想法是迭代树的所有节点,并为每个节点确定它是否被连接器实例的原点包围。然后,我们查询该连接器的目标对象。最后,我们获得节点表与节点连接到的对象列表:
```python
from ini.trakem2.display import Display, Connector
from jarray import array
from java.awt.geom import Area
from java.awt import Rectangle

# Obtain the currently selected treeline or areatree:
tree = Display.getFront().getActive()
affine = tree.getAffineTransform()
layerset = tree.getLayerSet()

# Maps of nd vs list of trees:
outgoing = {}   # e.g. presynaptic to some trees

for nd in tree.getRoot().getSubtreeNodes():
  # Obtain the node position in world coordinates
  fp = array([nd.getX(), nd.getY()], 'f')
  affine.transform(fp, 0, fp, 0, 1)
  x = int(fp[0])
  y = int(fp[1])
  # Query the LayerSet for Connector objects that intersect it
  cs = layerset.findZDisplayables(Connector, nd.getLayer(), x, y, False)
  if cs.isEmpty():
	continue
  # Else, get the target Tree instances that each connector links to:
  targets = []
  area = Area(Rectangle(x, y, 1, 1))
  for connector in cs:
	if connector.intersectsOrigin(area):
	  for target in connector.getTargets(Tree):
		targets.append(target)
  if len(targets) > 0:
	outgoing[nd] = targets

# print the map of nodes and the number of trees each connects to:
for node, targets in outgoing.iteritems():
  print node, " connects to", len(targets)
类Tree有一个方便的方法findConnectors()同样返回两个列表:传出Connector实例的列表和查找Connector实例的列表。从这些中,人们可以轻松获得连接图,您也可以通过右键单击显示器并选择“导出-连接图…”来获得该连接图。
##如何查找所有乔木的网络,通过连接器实例相关
最简单的方法是迭代所有连接器并查找它们关联的对象。 §§2§§§对象具有原点(根节点)和任意数量的目标(根节点的所有子节点)。每个节点都有一个半径; TrakEM2 项目中与该半径的世界坐标相交的任何其他对象都将被视为关联为原点或目标。
from ini.trakem2.display import Display, Connector, Tree

layerset = Display.getFront().getLayerSet()

# table of relationships: one source vs. its list of targets
graph = {}

for connector in layerset.getZDisplayables(Connector):
  targets = []
  for targetSet in connector.getTargets(Tree):
	for target in targetSet:
	  targets.append(target)
  for origin in connector.getOrigins(Tree):
	ls = None
	if graph.has_key(origin):
	  graph[origin] += targets
	else:
	  graph[origin] = targets

# print the graph (we print the id of each object):
for origin,targets in graph.iteritems():
  tids = ""
  for target in targets:
	tids += str(target.id) + ", "
  print origin.id, "=>", tids
请注意,我们如何调用 getOrigins(Tree) 和 getTargets(Tree),过滤所有潜在的来源和目标(Patch–Image–、AreaList 等),以便只有 Tree 实例出现在列表中。
注意:您可能还想使用右键单击弹出菜单中的“导出 - NeuroML”菜单命令。
测量神经元乔木中的所有脊柱
更新:从版本 0.8n 开始,此功能包含在 TrakEM2 中。右键单击选中的树线或区域树,然后选择“测量 - 标记为…的所有节点对之间的最短距离”
这个想法是用标签“颈部开始”来标记颈部颈部的开始,用标签“颈部结束”来标记颈部颈部的颈部。假设“下一个结束”永远在“颈部开始”节点的子树中;换句话说,颈部的方向是从“颈部开始”到“颈部结束”。
然后,我们迭代心脏轴的所有节点,寻找带有“颈部起始”标签的节点,并测量颈部的计算长度。所有颈部颈部的所有测量值都会打印出来。
# 2011-03-13 Albert Cardona for Nuno da Costa
#
# For a given Treeline or AreaTree that represents a neuronal arbor,
# find all nodes that contain the tag "neck start"
# and for each of those find the distance to a node
# in their subtree that contains the tag "neck end".
#
# In short, measure the lengths of all spine necks
# labeled as such in the arbor.


from math import sqrt
from ini.trakem2.display import Display, AreaTree, Treeline

def findNeck(startNode):
  ** Assumes necks are not branched. **
  neck = []
  for node in startNode.getSubtreeNodes():
	tags = getTagsAsStrings(node)
	if tags is None or not "neck end" in tags:
	  neck.append(node) # growing the neck
	  continue
	# Else, end of neck:
	neck.append(node)
	return neck
  print "Did not find a node with an end tag, for parent node " + startNode
  return None # end tag not found!


def getTagsAsStrings(node):
  found = set()
  tags = node.getTags()
  if tags is None or 0 == len(tags):
	return found
  for tag in tags:
	found.add(tag.toString())
  return found


def measureSpineNecks(neuron):
  ** Expects an AreaTree or a Treeline for neuron.
  Assumes that nodes with a tag "neck start" are parents or superparents of nodes with tags of "neck end".
  **
  print "Measurements for neuron '" + str(neuron) + "':"
  for node in neuron.getRoot().getSubtreeNodes():
	# Check if the node has the start tag
	tags = getTagsAsStrings(node)
	if tags is None or not "neck start" in tags:
	  continue
	# Find its child node that has an end tag
	neck = findNeck(node)
	if neck is None:
	  continue
	distance = neuron.measurePathDistance(neck[0], neck[-1])
	print "  id:", neuron.getId(), "-- neck length: ", distance


def isTree(x):
  return isinstance(x, Treeline) or isinstance(x, AreaTree)


# Measure in all treelines or areatrees:
#trees = filter(isTree, Display.getFront().getLayerSet().getZDisplayables())

# Measure only in the selected treelines or areatrees:
trees = filter(isTree, Display.getSelected())

if 0 == len(trees):
  print "No trees found!"
else:
  for neuron in trees:
	measureSpineNecks(neuron)
与 Ball 对象交互
设置项目中所有Ball对象的所有球的半径
##############
# Set a specific radius to all individual spheres
# of all Ball objects of a TrakEM2 project.


calibrated_radius = 40  # in microns, nm, whatever


display = Display.getFront()
layerset = display.getLayerSet()
cal = layerset.getCalibration()
# bring radius to pixels
new_radius = calibrated_radius / cal.pixelWidth

for ballOb in layerset.getZDisplayables(Ball):
  for i in range(ballOb.getCount()):
	ballOb.setRadius(i, new_radius)
  ballOb.repaint(True, None)
##############
将所有 Ball 对象导出为 CSV 文件
# Open a text window containing all Ball objects as a CSV file,
# in calibrated coordinates.
# The text window has a "File - Save" menu for saving to a file.

# Albert Cardona 2015-07-02 for Jemima Burden at UCL.

# See also the API of the Ball class:
# https://github.com/trakem2/trakem2/blob/-/src/main/java/ini/trakem2/display/Ball.java#L716


from ini.trakem2.display import Display, Ball
from ij.text import TextWindow

ball_obs = Display.getFront().getLayerSet().getZDisplayables(Ball)

# One entry for each id,x,y,z,r
rows = []

# Iterate every Ball instance, which contains one or more x,y,z,r balls
for ball_ob in ball_obs:
  id = ball_ob.getId()
  # Iterate every x,y,z,r ball of a Ball instance, calibrated
  wbs = ball_ob.getWorldBalls()
  for ball_coords in wbs:
	# Store every ball as a row with id, x, y, z, r
	rows.append(str(id) + "," + ",".join(str(c) for c in ball_coords))

csv = "\n".join(rows)

t = TextWindow("Balls CSV", csv, 400, 400)
生成3D网格
在 TrakEM2 中,3D网格生成为每个对象的 Point3f 列表。然后,该列表将被包装到 3D 查看器库的 CustomMesh 的任何子类中,例如 CustomTriangleMesh 或 CustomLineMesh。然后,这些网格对象被封装到 Content 对象中,并添加到 Image3DUniverse 的实例中,这是3D 查看器的主窗口。
当然,通过编写脚本,可以省略其中许多步骤。以下是有关如何以编程方式生成并保存其保存为 Wavefront 格式的几个示例。
为AreaList生成3D网格
该脚本说明了如何绕过 3D 查看器从 AreaList 生成网格,然后以 Wavefront 格式导出数据。该脚本导出一个在前面的显示中已选择的 AreaList。
要返回所有指定的对象,请循环执行Display.getSelected()。
要导出所有区域列表,请循环遍历Display.getFront().getLayerSet().getZDisplayables(AreaList)。
from ini.trakem2.display import Display
from org.scijava.vecmath import Color3f
from customnode import WavefrontExporter, CustomTriangleMesh
from java.io import StringWriter
from ij.text import TextWindow

# Get the selected AreaList
arealist = Display.getSelected()[0]

# Create the triangle mesh with resample of 1 (no resampling)
# CAUTION: may take a long time. Try first with a resampling of at least 10.
resample = 1
triangles = arealist.generateTriangles(1, resample)

# Prepare a 3D Viewer object to provide interpretation
color = Color3f(1.0, 1.0, 0.0)
transparency = 0.0
mesh = CustomTriangleMesh(triangles, color, transparency)

# Write the mesh as Wavefront
name = "arealist-" + str(arealist.id)
m = {name : mesh}
meshData = StringWriter()
materialData = StringWriter()
materialFileName = name + ".mtl"
WavefrontExporter.save(m, materialFileName, meshData, materialData)

# Show the text of the files in a window
# then you save it with "File - Save"
TextWindow(".obj", meshData.toString(), 400, 400)
TextWindow(materialFileName, materialData.toString(), 400, 400)
为区域树生成3D网格
类似于 AreaList 一样(见下文),但使用以下方法三角形提取:
triangles = areatree.generateMesh(1, resample).verts
AreaTree的generateMesh返回一个MeshData对象,其中包含边界列表和每个边界的颜色列表。 AreaTree的generateTriangles方法返回Point3f的列表,这些列表已准备好创建CustomLineMesh(在PAIRWISE模式下)来表示模块。
运行任务时保存项目
任务运行时,右键菜单仅显示取消任务的边界。要在任务运行时保存项目,请在 Jython Interpreter 中键入以下内容,然后按回车键执行:
Display.getFront().getProject().save()
如果您想编辑项目属性,以下代码将打开“项目 - 属性…”对话框:
Display.getFront().getProject().adjustProperties()
在上面的对话框中,您将能够设置自动保存间隔(请参见打开对话框的底部文本字段)。间隔默认为零(表示从不)。例如将其设置为 30(每半小时一次)。
当然,在</b>运行长任务设置之前自动保存间隔可能会更容易!
创建 TrakEM2 项目以实现快速可视化,消耗mipmap
创建一个避免生成 mipmap 的 TrakEM2 项目,然后从具有四列的文本文件导入大量图像:文件路径、X、Y 以及每个图图像块的部分索引。然后获取第一部分的快照。
该脚本的结果是,“/plugins/trakem2”窗口中将打开一个新的“项目”选项卡,并且将显示一个新的“显示”窗口。随时运行“project.saveAs(xmlfilepath)”将项目存储在XML文件中,从这时起只需“project.save()”即可。或者右键单击并选择“项目 - 保存”,或按“s”。
# Albert Cardona 2011-02-02
# At Madison, Wisconsin, with Erwin Frise
from ini.trakem2 import Project
from ij.gui import Toolbar
from java.awt import Color
from ij import ImagePlus

project = Project.newFSProject("blank", None, "/home/albert/Desktop/t2/")
loader = project.getLoader()
loader.setMipMapsRegeneration(False) # disable mipmaps
layerset = project.getRootLayerSet()
layerset.setSnapshotsMode(1) # outlines

task = loader.importImages(
		  layerset.getLayers().get(0),  # the first layer
		  "/home/albert/Desktop/t2/example-data/images/list.txt", # the absolute file path to the text file with absolute image file paths
		  " ", # the column separator  <path> <x> <y> <section index>
		  1.0, # section thickness, defaults to 1
		  1.0, # calibration, defaults to 1
		  False, # whether to homogenize contrast, avoid
		  1.0) # scaling factor, default to 1

task.join() # Optional: wait until all images have been imported

# Export a snapshot of the layer at 25% magnification

scale = 0.25
layer = layerset.getLayers().get(0)
flat = loader.makeFlatImage(ImagePlus.COLOR_RGB, layer, layerset.get2DBounds(), scale, layer.getAll(Patch), Color.black)

imp = ImagePlus("snap " + str(scale), flat).show()

print "done!"
#创作8位、16位、32位或RGB的快照
从右键单击菜单中,可以选择“导出 - 制作平面图像”,这会打开一个对话框,让您在 8 位和 RGB 之间进行选择。这些快照是从 mipmap 创建的,它们都是 8 位或 RGB 图像。
有时,人们希望以原始位深度(如16位或32位)创建图像的纸张化蒙太奇。因此,存在静态函数Patch.makeFlatImage。
下面是一个例子,对于给定的Layer和其中的一组选定的Patch实例(图像图块),它会生成一个16位平面蒙太奇图像,把它作为ImageJ的ImageProcessor返回,比例为原始比例的50%。
from ini.trakem2.display import Display, Patch
from java.awt import Color

front = Display.getFront() # the active TrakEM2 display window
layer = front.getLayer()
tiles = front.getSelection().get(Patch)  # selected Patch instances only
backgroundColor = Color.black
scale = 0.5

roi = tiles[0].getBoundingBox()
for tile in tiles[1:]:
  roi.add(tile.getBoundingBox())

print "Creating flat image from", len(tiles), "image tiles"

ip = Patch.makeFlatImage(
		   ImagePlus.GRAY16,
		   layer,
		   roi,
		   scale,
		   tiles,
		   backgroundColor,
		   True)  # use the min and max of each tile

imp = ImagePlus("Flat montage", ip)
imp.show()
对于其他输出类型,请使用 ImagePlus.GRAY8、.GRAY16、GRAY32 或 .COLOR_RGB,如 ImagePlus 类的文档中所列。
丰富的 TrakEM 的 GUI
###添加额外的选项卡来显示
TrakEM API 随时可访问。以下是向添加新选项卡的示例。新选项卡由一个 JPanel 组成,其中有一个按钮。
请注意,Jython 允许您将事件监听器的方法定义为构造函数的附加参数。因此,JButton 只需通过引用已声明的方法即可获取 actionPerformed 方法(来自 ActionListener 接口)。
# Albert Cardona 2010-03-19 at EMBL
# Specially demo'ed for Larry Lindsey

def doSomething(evt):
  IJ.showMessage("Button pushed!")

def addReconstructToolkit(display):
  tabs = display.getTabbedPane()
  # Check that it's not there already
  title = "Reconstruct toolbar"
  for i in range(tabs.getTabCount()):
	if tabs.getTitleAt(i) == title:
	  IJ.showMessage("Reconstruct toolbar already in this Display!")
	  return
  # Otherwise, add it new:
  from javax.swing import JPanel, JButton
  pane = JPanel()
  b = JButton("Push it", actionPerformed=doSomething)
  pane.add(b)
  tabs.add(title, pane)


front = Display.getFront()
if front is not None:
  addReconstructToolkit(front)
else:
  IJ.showMessage("Open a display first!")
#另请参阅
TrakEM2 教程
- TrakEM2 how to,带有java代码示例。
- TrakEM2 video tutorials。
Jython 脚本
——斐济Jython Scripting。
- Jython webpage。
- Jython 中的Fiji scripting tutorial。
TrakEM2 的 Jython 脚本
以下所有内容均包含在斐济的 plugins/Examples/plugins/trakem2_Example_Scripts/ 文件夹中:
- TrakEM2 中的Set all transforms to identity。
- Extract stack under AreaList 对于 TrakEM2 对象。
- TrakEM2 中的Measure AreaList对象。
- TrakEM2 中的Select All。
- A collection of scripts for TrakEM2,由 github 托管。当用于神经回路重建时,主要与检查和分析 Treeline、AreaTree 和 Connector 实例。