


Gnu_Plot 插件提供了 ImageJ 和 Gnuplot 之间的粘合剂。开发这个插件的主要动力是 ImageJ 熟练查询推理数据,Gnuplot 熟练生成可发布的绘图,而我很懒。麻烦必须从 ResultsTable 或通过 Java 插件生成可绘图数据,然后粘贴到 ascii 编辑器中,保存,继续运行 gnuplot,从显示输出图像,然后重复。我更喜欢找到更好的可数据或使用 Gnuplot脚本进行修改后单击一个按钮。
##特点
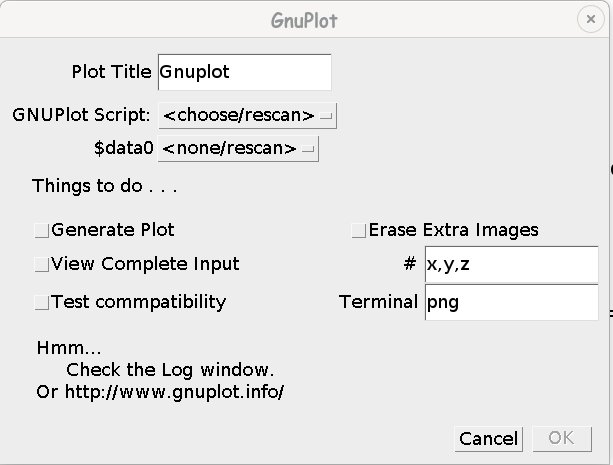
Gnu_Plot GUI
当作为插件运行时,Gnu_Plot 将收集 Gnuplot 脚本和数据,并通过 gnuplot 执行文件作为 stdin 运行它,从 stdout 读取图像并将其显示在 ImagePlus 窗口中,并在日志窗口中显示来自 stderr 的任何错误。
绘图标题将用于创建任何脚本或图片指定的标题。
Gnuplot 脚本 是一个编辑器窗口,可以是新脚本、从磁盘读取的脚本或现有编辑器窗口。
$data# inline/here document 可绘制数据集可以是(未指定)PlotWindow 或 ResultsTable。可以指定多个数据集。
Gnu_Plot 窗口可以保持打开状态,可以发现新的脚本或数据集以供后续选择。
生成绘图将收集选定的信息,通过 gnuplot 发送,并提交结果。如果需要,您可以保留除最后生成的绘图图像之外的所有图像。
完整输入将收集选定的信息放在编辑器窗口中。如果稍后需要删除查看输出并且您会像我一样忘记数据的无效来源,那么非常适合调试或保存;输入是添加到脚本文件中的注释。
测试兼容性将运行一个非常简单的 Gnuplot 脚本,该脚本应该生成指定选项选项的图形描述;之后输入将放置在脚本中的“设置条款”。并非所有条款都受您支持,并且/或者,可能没有按照此插件的预期安装 gnuplot 执行文件,请参阅“日志”窗口。
示例
假设您想查看极坐标格式的相位的图像直方图。
1.点击直方图窗口底部的列表按钮。
- 启动 Gnu_Plot 插件。
- 为GNUPlot脚本选择
<new>。 - 将上述脚本复制/粘贴到编辑器窗口中。
set terminal pngcairo size 512,512 stats '$data0' using 3 name 'y' nooutput set polar set angles radians unset key unset xtics unset ytics set border 0 set size square set grid polar ls 12 set xrange [-y_max*1.1:y_max*1.1] set yrange [-y_max*1.1:y_max*1.1] set ttics ('-2π' -2*pi, '-π' -pi, 0, 'π' pi, '2π' 2*pi) plot "$data0" using 2:3 with linespoints5.选择$data0的*…直方图
6.单击“生成绘图”
##方法
public static String gnuplot()
public static String gnuplot(String gp)
如果需要,识别gnuplot可执行文件。
public static ImagePlus process(String gps, String title)
public static boolean processAndDisplay(String gps, String title)
从完整的 Gnuplot 脚本生成的绘图。
public static String plotgs(String code, double[][]... arrs)
public static String plotgs(String code, float[][]... arrs)
生成完整的情节脚本。每个arrs都会生成一个单独的此处文档数据块。
public static ImagePlus plot(String title, String code, double[][]... arrs)
public static ImagePlus plot(String title, String code, float[][]... arrs)
生成ImagePlus。每个arrs都会生成一个单独的here-document数据块。
编码好东西
生成数据,通过另一个文件运行它,并使用输出。
动态更新选择。
安装
将Gnu_Plot.zip解压缩到ImageJ插件Edit › Options › Gnu_Plot…或plugins/jars目录中。源代码在jar文件中。
Edit › Options › Gnu_Plot… Configure location of gnuplot executable.
Analyze › Tools › Gnu_Plot… Runs Gnu_Plot.
许可证
GPL 发放许可证。
变更日志
2020年4月1日初始版本。
已知错误
让我知道。